Updated: 17-Nov-25 17:04 ET
| September Construction Spending |
| Updated: 17-Nov-25 17:04 ET |


Highlights
- Total construction spending increased 0.2% month-over-month in August (Briefing.com consensus: 0.1%) following an upwardly revised 0.2% increase (from -0.1%) in July.
- Total private construction was up 0.3% month-over-month, while total public construction was flat month-over-month.
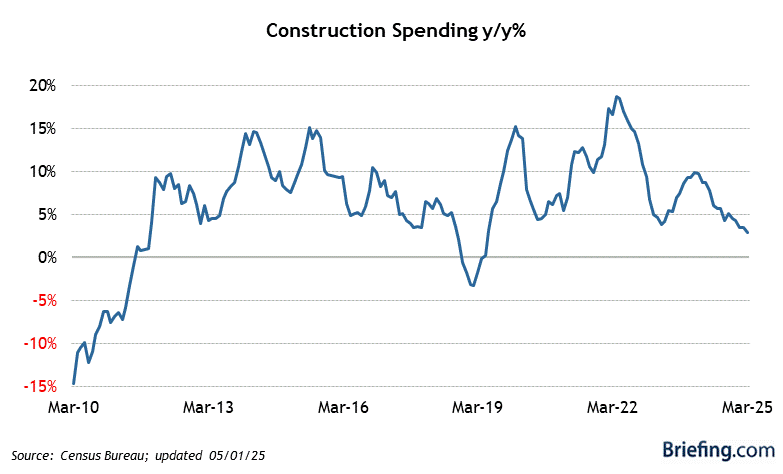
- On a year-over-year basis, total construction spending was down 1.6%.
Key Factors
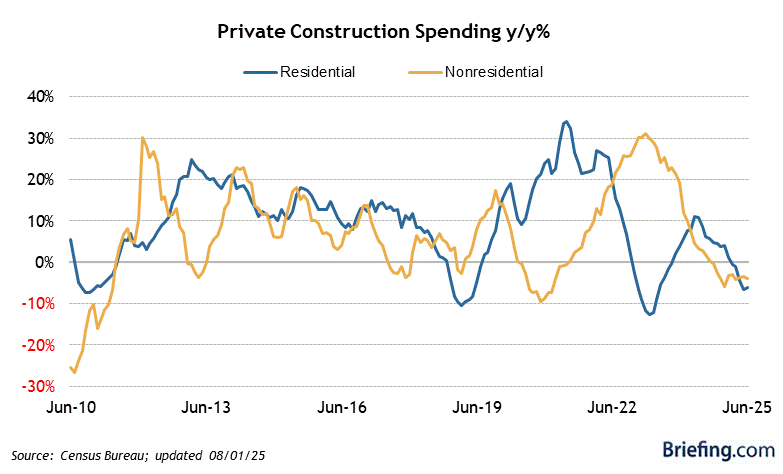
- Total residential spending increased 0.8% month-over-month, while nonresidential spending fell 0.2% month-over-month.
- In private construction, residential spending increased 0.8%, with new single-family construction down 0.4% and multifamily construction up 0.2%. Nonresidential spending declined 0.3%, led by a 1.0% decline in manufacturing spending.
- In public construction, nonresidential spending declined 0.1% month-over-month, with highway and street spending down 0.2%.
Big Picture
- The key takeaway from the report is that the increase in spending came solely from the residential side; unfortunately, that did not include new single-family construction activity. The strength was concentrated in new multifamily construction.
| Category | AUG | JUL | JUN | MAY | APR |
| Nominal (Current) Dollars | |||||
| Total Construction | 0.2% | 0.2% | 0.5% | -0.2% | 0.1% |
| Private | 0.3% | 0.1% | 0.6% | -0.3% | -0.2% |
| Residential | 0.8% | 0.7% | 1.1% | -0.3% | -0.4% |
| Nonresidential | -0.3% | -0.5% | 0.1% | -0.3% | 0.0% |
| Public | 0.0% | 0.4% | 0.2% | 0.1% | 1.1% |
|
|