Updated: 09-Jan-26 09:42 ET
| December Nonfarm Payrolls |
| Updated: 09-Jan-26 09:42 ET |


Highlights
- The employment situation in December was better than feared and not entirely bad, unless one is counted among the long-term unemployed.
Key Factors
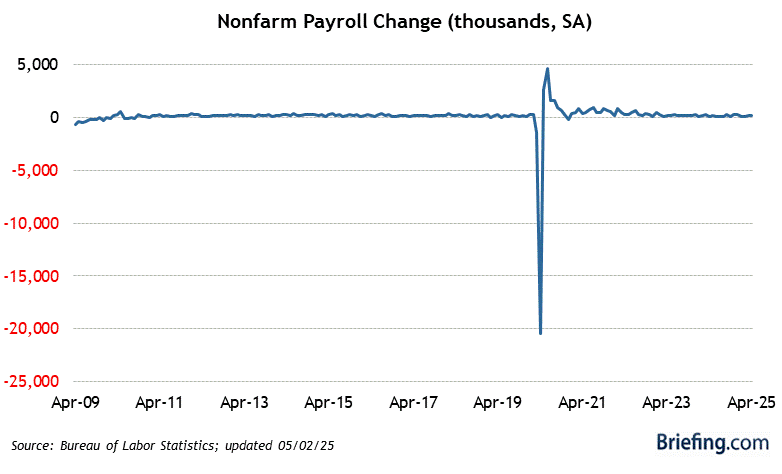
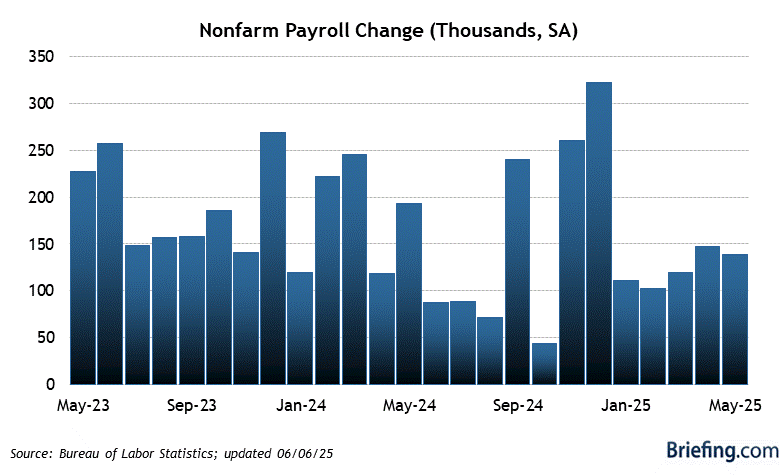
- December nonfarm payrolls increased by 50,000 (Briefing.com consensus: 55,000). The 3-month average for total nonfarm payrolls decreased to -22,000 from -3,000. November nonfarm payrolls revised to 56,000 from 64,000. October nonfarm payrolls revised to -173,000 from -105,000.
- December private sector payrolls increased by 37,000 (Briefing.com consensus: 50,000). November nonfarm payrolls revised to 50,000 from 69,000. October private sector payrolls revised to 1,000 from 52,000.
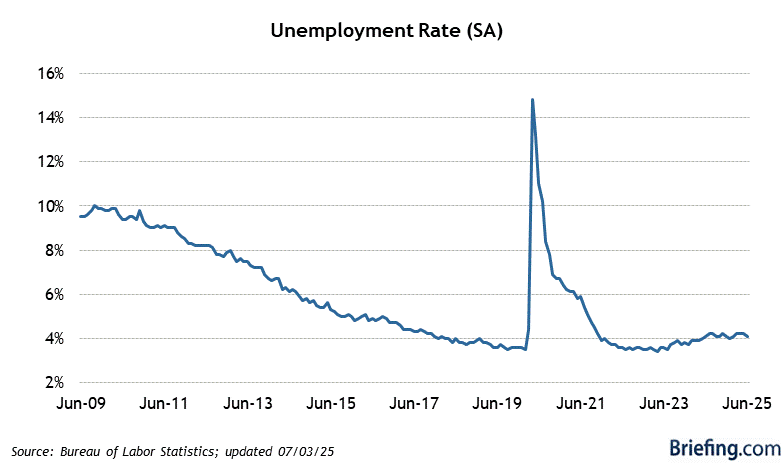
- December unemployment rate was 4.4% (Briefing.com consensus: 4.5%) versus downwardly revised 4.5% (from 4.6%) in November. Persons unemployed for 27 weeks or more accounted for 26.0% of the unemployed versus 24.4% in November. The U6 unemployment rate, which accounts for unemployed and underemployed workers, decreased to 8.4% from 8.7% in November.
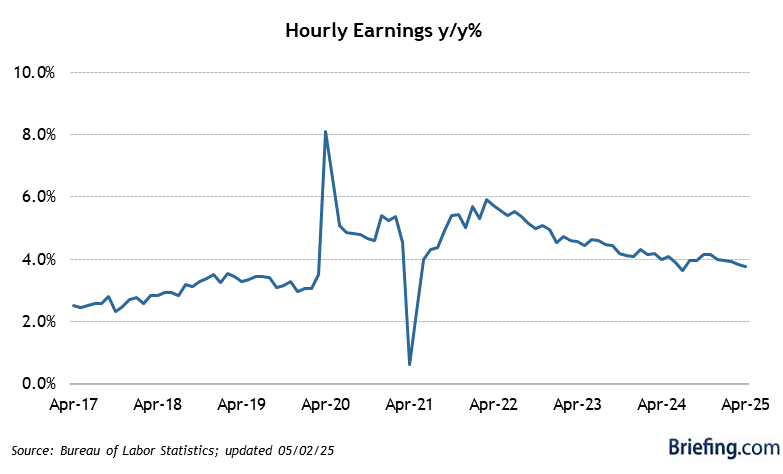
- December average hourly earnings were up 0.3% (Briefing.com consensus: 0.3%) versus an upwardly revised 0.2% increase (from 0.1%) in November. Over the last 12 months, average hourly earnings have risen 3.8% versus 3.6% for the 12 months ending in November.
- The average workweek in December was 34.2 hours (Briefing.com consensus: 34.3) versus 34.3 hours in November. The manufacturing workweek dipped 0.2 hour to 39.9 hours. Factory overtime was unchanged at 2.9 hours.
- The labor force participation rate decreased to 62.4% from 62.5% in November.
- The employment-population ratio increased to 59.7% from 59.6% in November.
Big Picture
- Granted, the employment situation could be better, but the key takeaway is that the low unemployment rate will temper concerns that consumer spending and the economy will slow rapidly due to a weak labor market. It will also likely keep the Fed's next rate cut at bay.
| Category | DEC | NOV | OCT | SEP | AUG |
| Establishment Survey | |||||
| Nonfarm Payrolls | 50K | 56K | -173K | 108K | -26K |
| Goods-Producing | -21K | 18K | -21K | 17K | -33K |
| Construction | -11K | 22K | -13K | 25K | -20K |
| Manufacturing | -8K | -2K | -9K | -5K | -11K |
| Service-Providing | 58K | 32K | 22K | 87K | 43K |
| Retail Trade | -25K | -17K | -24K | 23K | 5K |
| Financial | 7K | 0K | 1K | 6K | -15K |
| Business | -9K | 13K | -16K | -8K | -13K |
| Temporary help | -6K | -5K | -24K | -6K | -10K |
| Education/Health | 41K | 59K | 41K | 56K | 34K |
| Leisure/Hospitality | 47K | -3K | 33K | 42K | 23K |
| Government | 13K | 6K | -174K | 4K | -36K |
| Average Workweek | 34.2 | 34.3 | 34.2 | 34.2 | 34.2 |
| Production Workweek | 33.7 | 33.7 | 33.7 | 33.7 | 33.6 |
| Factory Overtime | 3.9 | 3.8 | 3.8 | 3.7 | |
| Aggregate Hours Index | -0.3% | 0.3% | 0.0% | 0.1% | -0.3% |
| Avg Hourly Earnings | 0.3% | 0.2% | 0.4% | 0.2% | 0.4% |
| Household Survey | |||||
| Household Survey | |||||
| Civilian Unemp. Rate | 4.4% | 4.5% | 4.4% | 4.3% | |
| Civilian Labor Force | -46K | 511K | 338K | ||
| Civilian Employed | 232K | 286K | 230K | ||
| Civilian Unemployed | -278K | 225K | 108K |
|
|