Updated: 03-Jun-26 10:59 ET
| April Factory Orders |
| Updated: 03-Jun-26 10:59 ET |
Highlights
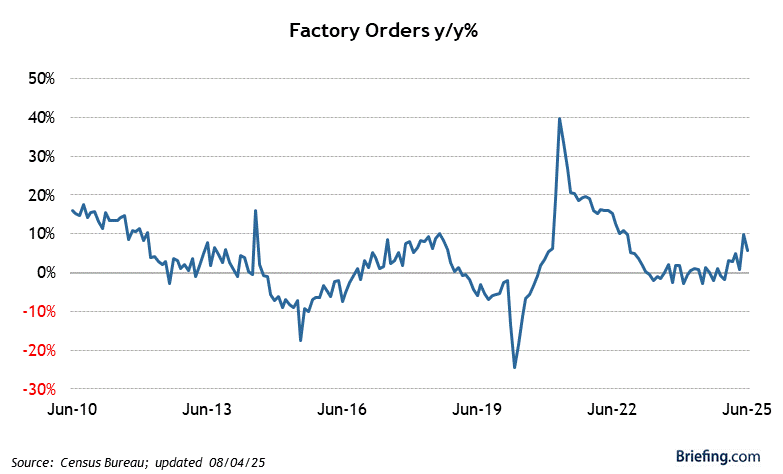
- Factory orders increased 4.8% month-over-month in April (Briefing.com consensus: 3.5%) following an upwardly revised 1.8% increase (from 1.5%) in March.
- Excluding transportation, factory orders increased 1.3% on the heels of a 1.8% increase in March. Shipments of manufactured goods were up 1.0% after increasing 1.5% in March.
Key Factors
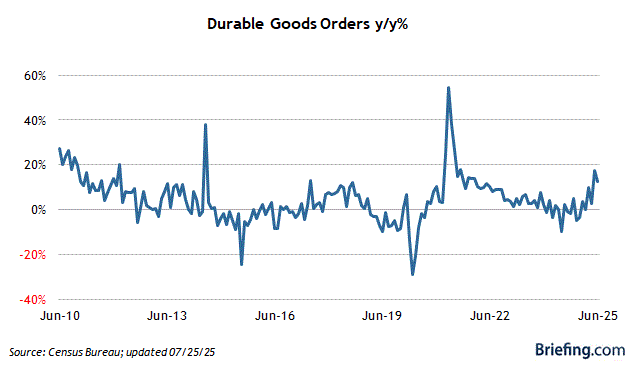
- Durable goods orders surged 8.0% after increasing 1.3% in March.
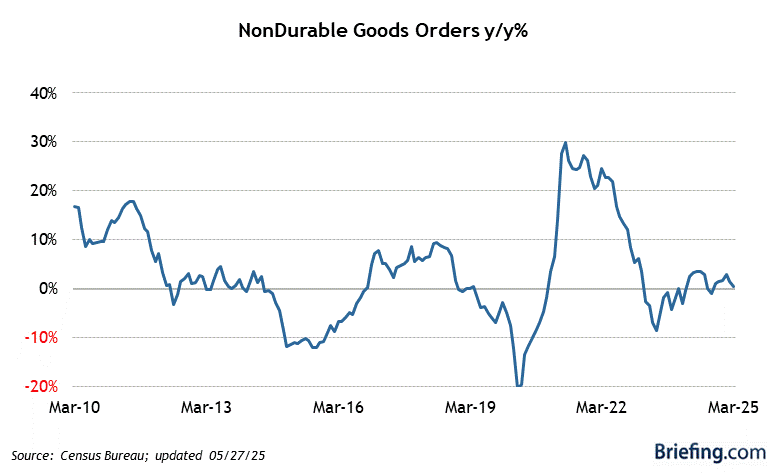
- New orders for nondurable goods jumped 1.4% after increasing 2.3% in March.
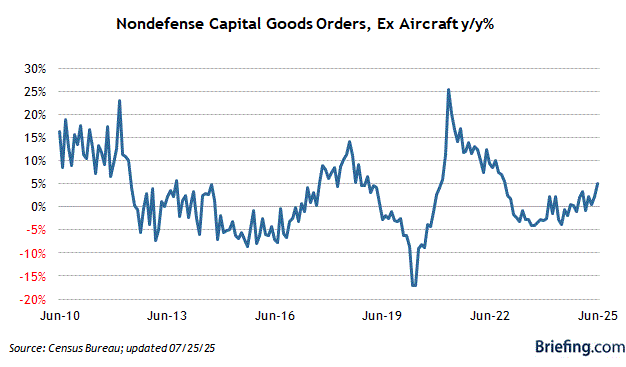
- New orders for nondefense capital goods excluding aircraft-a proxy for business spending-declined 1.0% following a 3.8% increase in March.
- The inventory-to-shipments ratio fell to 1.50 from 1.51 in March.
Big Picture
- The key takeaway from the report is that the headline numbers masked a weak month for business spending, evidenced by the 1.0% decline in nondefense capital goods orders, excluding aircraft. To be fair, that decline followed a very strong 3.8% increase in March, so it could just be a natural pullback after a large increase.
| Category | APR | Mar | Feb | Jan | Dec |
| Factory Orders | 4.8% | 1.8% | 0.3% | 0.0% | -0.4% |
| Less Defense | 4.7% | 1.0% | 0.3% | 0.4% | -0.9% |
| Durable Goods | 8.0% | 1.3% | -1.2% | -0.4% | -0.9% |
| Nondurable Goods | 1.4% | 2.3% | 1.9% | 0.5% | 0.1% |
| Unfilled Factory Orders | 1.7% | 0.2% | 0.1% | 0.6% | 0.9% |
| Factory Shipments | 1.0% | 1.5% | 1.7% | 0.7% | 0.7% |
| Factory Inventories | 0.3% | 0.7% | 0.1% | 0.1% | 0.1% |
| Inventory/Shipment Ratio | 1.50 | 1.51 | 1.52 | 1.55 | 1.56 |
|
|