Updated: 30-Jul-26 10:15 ET
| Q2 GDP-Adv. |
| Updated: 30-Jul-26 10:15 ET |
Highlights
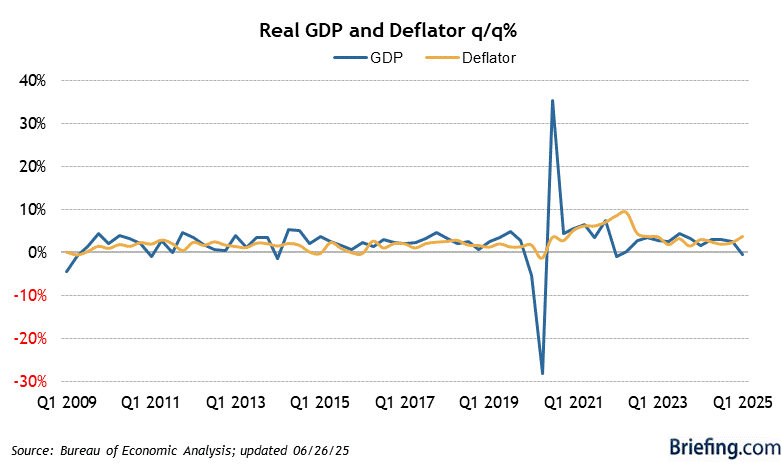
- The Advance Q2 GDP report showed real GDP increasing at an annual rate of 1.5% (Briefing.com consensus: 2.3%) on the heels of a 2.1% increase for Q1.
- The GDP Price Index increased by a whopping 6.3% (Briefing.com consensus: 3.7%) following a 3.6% increase in Q1.
Key Factors
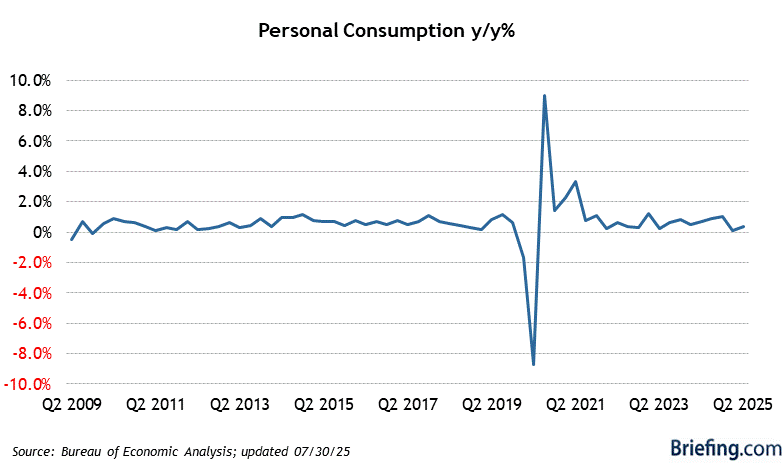
- Personal consumption expenditures increased 3.2%, up from 0.5% in the first quarter. The PCE component contributed 2.12 percentage points to real GDP growth in the second quarter, up from 0.37 percentage points in the first quarter.
- Gross private domestic investment was up 3.0% versus up 7.9% in the first quarter. Gross private domestic investment contributed 0.53 percentage points to growth in the second quarter, down from 1.35 in the first quarter.
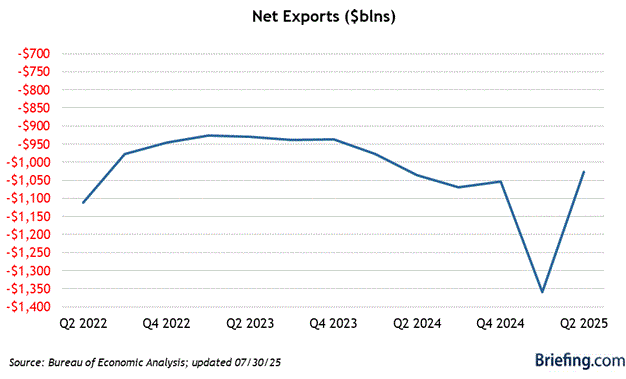
- Exports were up 4.5% versus 10.9% in the first quarter. Imports were up 11.5% following an 11.8% increase in the first quarter. Net exports subtracted 1.01 percentage points from growth in the second quarter versus subtracting 0.37 percentage points in the first quarter.
- Government spending decreased 0.8%, following a 4.4% increase in the first quarter. Government spending subtracted 0.14 percentage points from growth in the second quarter after contributing 0.74 percentage points in the first quarter.
- Real final sales of domestic product, which excludes the change in private inventories, increased 2.2%, up from a 1.9% increase in the first quarter.
- Real final sales to domestic purchasers increased 3.9%, up from 1.7% in the first quarter.
- The PCE Price Index increased 5.1%, versus 4.6% in the first quarter, while the core PCE Price Index, which excludes food and energy, increased 3.4%, down from 4.4% in the first quarter.
Big Picture
- While the headline GDP print is a bit disappointing, it is not as soft as it appears knowing that net exports subtracted 1.01 percentage points. The bright spot was the pickup seen in personal spending (+3.2% from +0.5%) and final sales to private domestic purchasers (+3.9% from +1.7%).
| Category | Q2 | Q1 | Q4 | Q3 | Q2 |
| GDP | 1.5% | 2.1% | 0.5% | 4.4% | 3.8% |
| Inventories (change) | -$50.8B | -$16.7B | -$15.6B | -$23.9B | -$18.3B |
| Final Sales | 2.2% | 1.9% | 0.3% | 4.5% | 7.5% |
| PCE | 3.2% | 0.5% | 1.9% | 3.5% | 2.5% |
| Nonresidential Inv. | 8.4% | 10.6% | 2.4% | 3.2% | 7.3% |
| Structures | -5.0% | -4.7% | -6.5% | -5.0% | -7.5% |
| Equipment | 15.2% | 15.8% | 4.3% | 5.3% | 8.5% |
| Intellectual Property | 8.8% | 13.8% | 5.4% | 5.6% | 15.0% |
| Residential Inv. | 1.5% | -7.8% | -1.7% | -7.1% | -5.1% |
| Net Exports | -$1074.7B | -$1001.8B | -$968.7B | -$955.5B | -$1058.0B |
| Export | 4.5% | 10.9% | -3.2% | 9.6% | -1.8% |
| Imports | 11.5% | 11.8% | -1.0% | -4.4% | -29.3% |
| Government | -0.8% | 4.4% | -5.6% | 2.2% | -0.1% |
| GDP Price Index | 6.2% | 3.6% | 3.7% | 3.8% | 2.1% |
|
|