Updated: 16-Jan-26 09:37 ET
| December Industrial Production |
| Updated: 16-Jan-26 09:37 ET |


Highlights
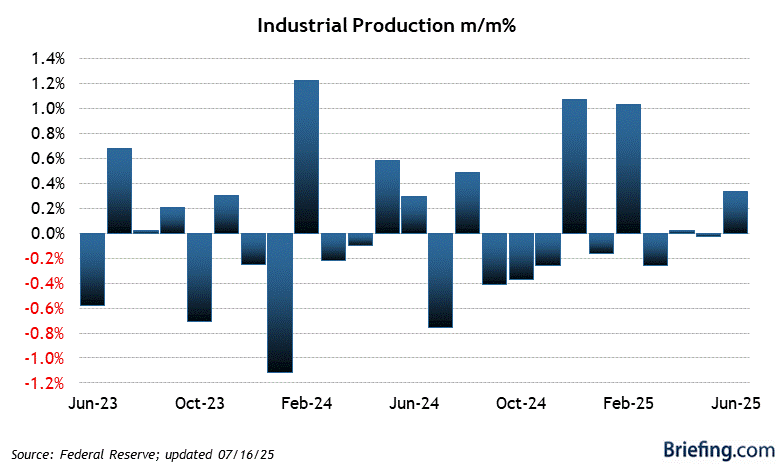
- Industrial production increased 0.4% month-over-month in December (Briefing.com consensus 0.2%) following an upwardly revised 0.4% increase (from 0.2%) in November.
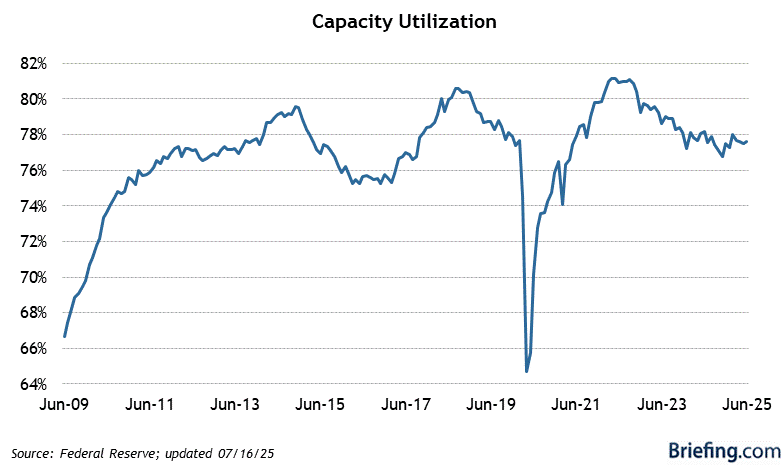
- The capacity utilization rate was 76.3% (Briefing.com consensus 76.0%) versus an upwardly revised 76.1% (from 76.0%) in November.
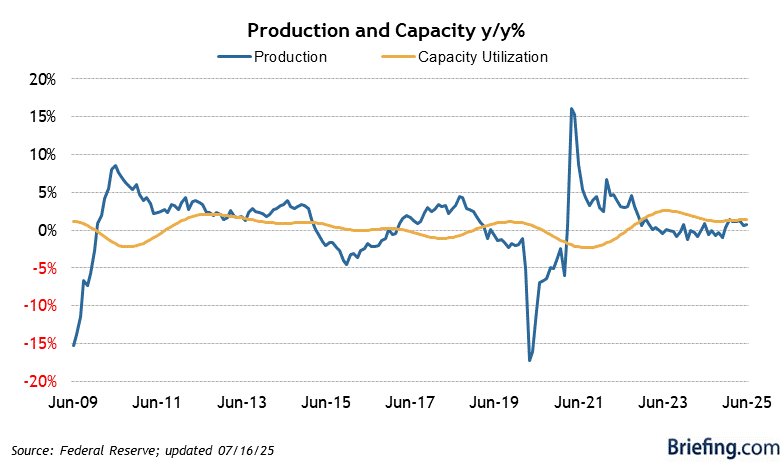
- Total industrial production increased 2.0% yr/yr, while the capacity utilization rate was 3.2 percentage points below its long-run average.
Key Factors
- Manufacturing output was up 0.2% month-over-month following an upwardly revised 0.3% increase (from 0.0%) in November. Motor vehicle assemblies were down 0.4% month-over-month to a seasonally adjusted annual rate of 9.68 million units. Manufacturing capacity utilization held steady at 75.6%.
- Mining output declined 0.7% month-over-month following a 1.7% increase in November. Mining capacity utilization dropped to 85.7% from 86.2%.
- Utilities output jumped 2.6% month-over-month following a 0.3% decline in October. Utilities capacity utilization rose to 72.3% from 70.3% in November.
Big Picture
- The key takeaway from the report is that manufacturing output was even better than the headline suggests given the nice upward revision for November. This is consistent with an economy that closed 2025 on a good note, notwithstanding the government shutdown in October.
| Category | DEC | NOV | OCT | SEP | AUG |
| Industrial Production | |||||
| Total Index | 0.4% | 0.4% | -0.3% | 0.2% | -0.3% |
| Manufacturing | 0.2% | 0.3% | -0.6% | 0.2% | 0.0% |
| Utilities | 2.6% | -0.3% | 2.1% | 1.1% | -3.1% |
| Mining | -0.7% | 1.7% | -0.7% | -0.7% | 0.8% |
| Capacity Utilization | |||||
| Total Industry | 76.3% | 76.1% | 75.8% | 76.1% | 76.1% |
| Manufacturing | 75.6% | 75.6% | 75.4% | 75.9% | 75.8% |
|
|