Updated: 08-Feb-22 19:13 ET
| July Leading Indicators |
| Updated: 08-Feb-22 19:13 ET |

Highlights
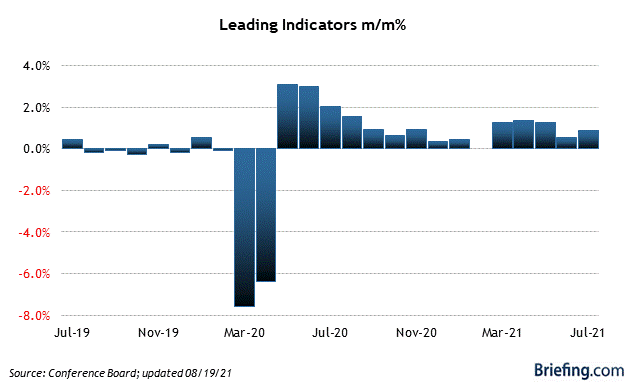
- The Conference Board's Leading Economic Index (LEI) increased 0.9% in July (Briefing.com consensus 0.8%) after increasing a downwardly revised 0.5% (from 0.7%) in June.
Key Factors
- The biggest contributors to the July increase were the ISM New Orders Index (0.19 percentage points), the Leading Credit Index (0.19 pp), the interest rate spread (0.14 pp), and stock prices (0.11 pp).
- In the six-month period ending July, the LEI increased 5.4% versus 5.0% during the previous six months.
- The Coincident Index rose 0.6% after increasing 0.4% in June.
- The Lagging Index jumped 0.6% after being unchanged in June.
Big Picture
- The key takeaway from the report is that overall growth was widespread, with all 10 indicators making positive contributions.
| Category | JUL | JUN | MAY | APR | MAR |
| Total Index | 0.9% | 0.5% | 1.2% | 1.3% | 1.3% |
| Manufacturing Workweek | 0.07% | -0.13% | 0.00% | -0.07% | 0.20% |
| Initial Claims | 0.02% | 0.25% | 0.88% | 0.81% | 0.35% |
| Cons. Gds Orders | 0.02% | -0.13% | -0.11% | -0.24% | 0.05% |
| ISM New Orders | 0.19% | 0.21% | 0.23% | 0.18% | 0.25% |
| Nondef. Cap Gds Orders, exc. Aircraft | 0.02% | 0.00% | -0.01% | 0.09% | 0.06% |
| Building Permits | 0.07% | -0.16% | -0.08% | -0.04% | 0.05% |
| Stock Prices | 0.11% | 0.07% | 0.03% | 0.23% | 0.03% |
| Leading Credit Index | 0.19% | 0.20% | 0.16% | 0.15% | 0.12% |
| Interest Rate Spread | 0.14% | 0.16% | 0.17% | 0.17% | 0.17% |
| Consumer Expectations | 0.10% | 0.12% | 0.06% | 0.10% | 0.11% |