Updated: 13-Jan-26 10:27 ET
| October New Home Sales |
| Updated: 13-Jan-26 10:27 ET |


Highlights
- The Department of Commerce released September and October new home sales data as it bids to catch up to release data following the government shutdown.
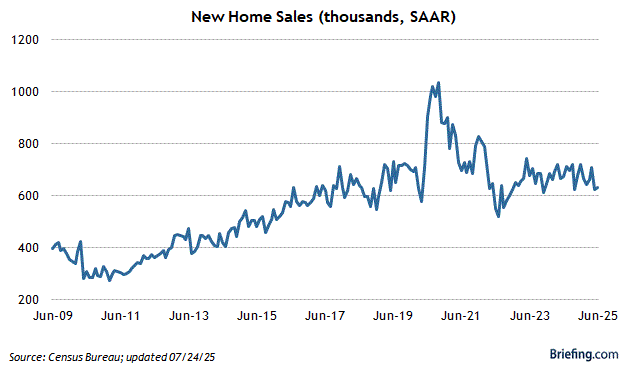
- September new home sales increased 3.8% month-over-month to a seasonally adjusted annual rate of 738,000 units versus a downwardly revised 711,000 units (from 800,000) in August.
- October new home sales dipped 0.1% month-over-month to a seasonally adjusted annual rate of 737,000 units.
Key Factors
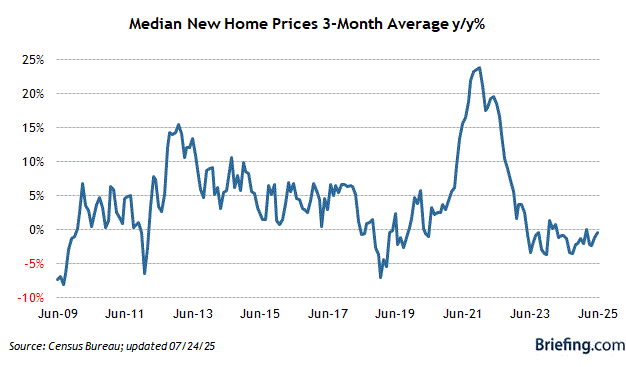
- The median sales price decreased 3.3% yr/yr in October to $392,300, while the average sales price increased 3.0% yr/yr to $498,000.
- New home sales month-over-month/year-over-year by region in October: Northeast (-14.3%/-40.0%); Midwest (-9.0%/+21.3%); South (+16.9%/+42.1%); and West (-36.3%; -24.8%).
- At the current sales pace, the supply of new homes for sale stood at 7.9 months, unchanged from September and versus 9.3 months in the year-ago period.
- The percentage of new homes sold for $399,000 or less accounted for 54% of new homes sold versus 48% in September. Homes priced between $400,000 and $799,000 accounted for 38% of new homes sold versus 44% in September. New homes priced at $800,000 or over accounted for 8% of sales in October versus 9% in September.
Big Picture
- The key takeaway from the report is that the South region-the nation's largest housing sector-was the sole source of strength in October. Home sales declined in all other regions, with higher home prices, on average, acting as a headwind.
| Category | OCT | SEP | AUG | JUL | JUN |
| Total Sales | 737K | 738K | 711K | 639K | 662K |
| Inventory (months) | 7.9 | 7.9 | 8.3 | 9.3 | 8.9 |
| Median Price Y/Y | -8.0% | -3.6% | 3.5% | -7.4% | -1.2% |