Updated: 09-Jan-26 09:29 ET
| December Housing Starts |
| Updated: 09-Jan-26 09:29 ET |


Highlights
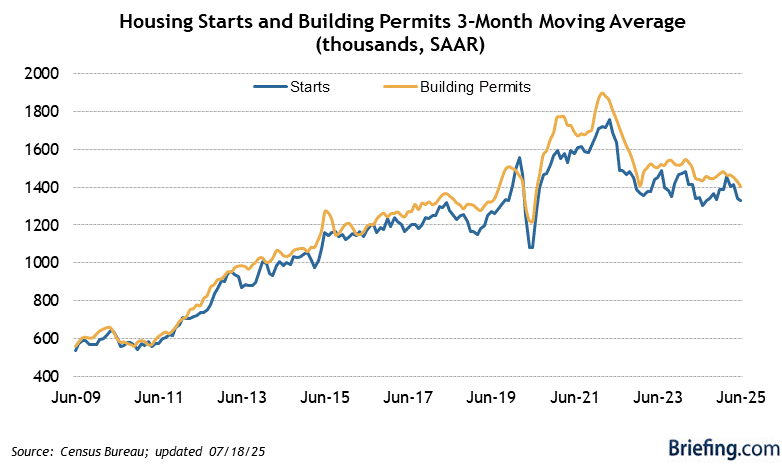
- Housing starts in October declined 4.6% month-over-month to a seasonally adjusted annual rate of 1.246 million (Briefing.com consensus: 1.340 million).
- Building permits decreased 0.2% to a seasonally adjusted annual rate of 1.412 million (Briefing.com consensus: 1.355 million).
Key Factors
- The change in single-unit starts by region: Northeast (+44.2%); Midwest (+22.6%); South (+8.2%); and West (-21.4%).
- The change in single-unit permits by region: Northeast (+3.4%); Midwest (-5.3%); South (-0.6%); and West (+2.2%).
- Multi-unit starts declined 22.0% month-over-month, while multi-unit permits were flat month-over-month.
- The number of units under construction at the end of the period dipped 0.2% month-over-month to a seasonally adjusted annual rate of 1.315 million, with single-unit dwellings under construction sliding 0.8% to 596,000.
Big Picture
- The key takeaway from the report is that the weakness in starts was driven entirely by multi-family units. Single-unit starts were up 5.4% month-over-month and at their highest level since July.
| Category | OCT | SEP | AUG | JUL | JUN |
| Starts | 146K | 1306K | 1291K | 1420K | 1382K |
| 1 Unit | 874K | 829K | 869K | 951K | 925K |
| Multi Units | 372K | 477K | 422K | 469K | 457K |
| Permits | 1412K | 1415K | 1330K | 1362K | 1393K |
|
|