Updated: 29-Jan-26 09:29 ET
| November Trade Balance |
| Updated: 29-Jan-26 09:29 ET |


Highlights
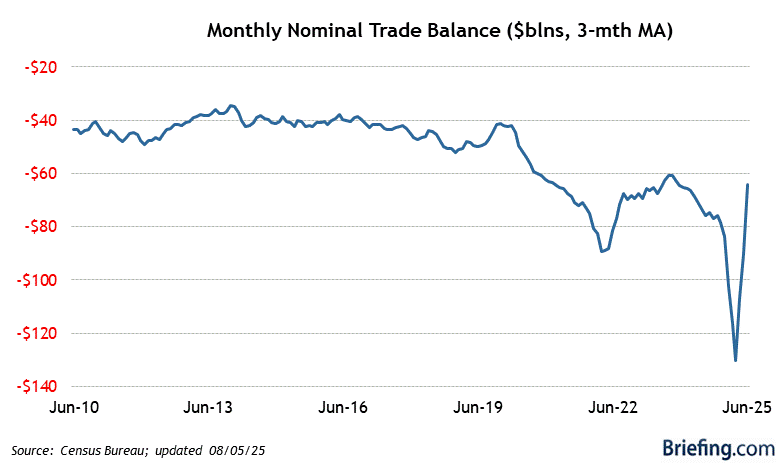
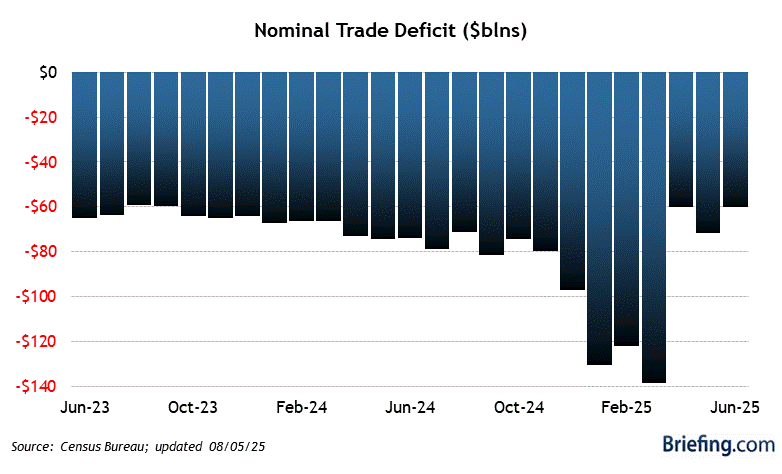
- The U.S. trade deficit widened to $56.8 billion in November (Briefing.com consensus: -$43.5 billion) from an upwardly revised $29.2 billion (from -$29.4 billion) in October.
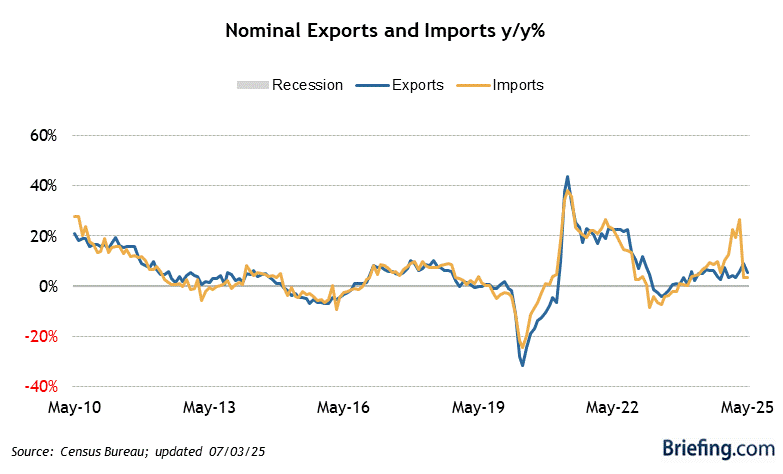
- Exports were $10.9 billion less than October exports, and imports were $16.8 billion more than October imports.
Key Factors
- Exports of industrial supplies and materials decreased $6.1 billion, led by nonmonetary gold (-$4.2 billion).
- Exports of consumer goods decreased $3.1 billion, led by pharmaceutical preparations (-$2.9 billion).
- Imports of consumer goods jumped $9.2 billion, led by pharmaceutical preparations ($6.7 billion).
- Imports of capital goods rose $7.4 billion, led by computers ($6.6 billion).
- The real goods trade deficit increased $23.5 billion to $87.1 billion in November. That left the Q4 average 13.7% below the Q3 average.
Big Picture
- The key takeaway from the report is that it will create a drag on Q4 GDP growth expectations. A possible silver lining, though, is that the import activity could be construed as a reflection of increased demand in the U.S.
| Category | NOV | OCT | SEP | AUG | JUL |
| Trade Deficit | -$56.8B | -$29.2B | -$48.1B | -$55.6B | -$77.4B |
| Exports | $292.1B | $302.9B | $294.2B | $284.1B | $283.9B |
| Imports | $348.9B | $332.1B | $342.3B | $339.7B | $361.3B |