Updated: 15-Jul-26 09:22 ET
| June PPI |
| Updated: 15-Jul-26 09:22 ET |
Highlights
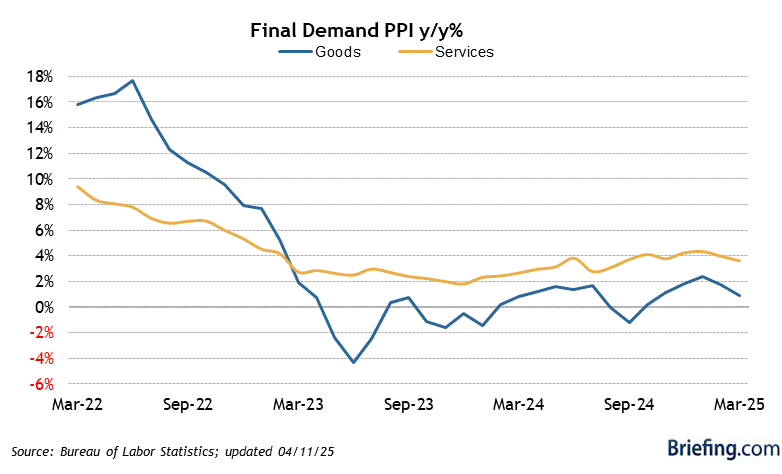
- Total PPI decreased 0.3% month-over-month in June (Briefing.com consensus: 0.1%) following a downwardly revised 0.6% increase (from 1.1%) in May. The June drop was driven by a 1.4% decline in prices for final demand goods, which was paced by a 6.4% decline in prices for final demand energy.
- Core PPI, which excludes food and energy, was up 0.2% month-over-month (Briefing.com consensus: 0.4%) following a downwardly revised 0.1% increase (from 0.4%) in May.
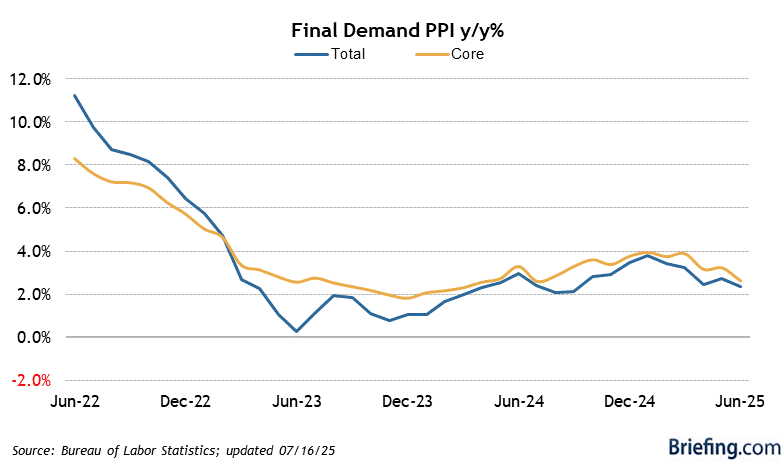
- On a year-over-year basis, total PPI was up 5.5% versus 6.0% in May, and core PPI was up 4.7% versus 4.6% in May.
Key Factors
- The index for final demand goods decreased 1.4%, its largest decline since July 2022.
- The index for final demand services was up 0.2% (and up 4.6% year-over-year) following a 0.1% decline in May.
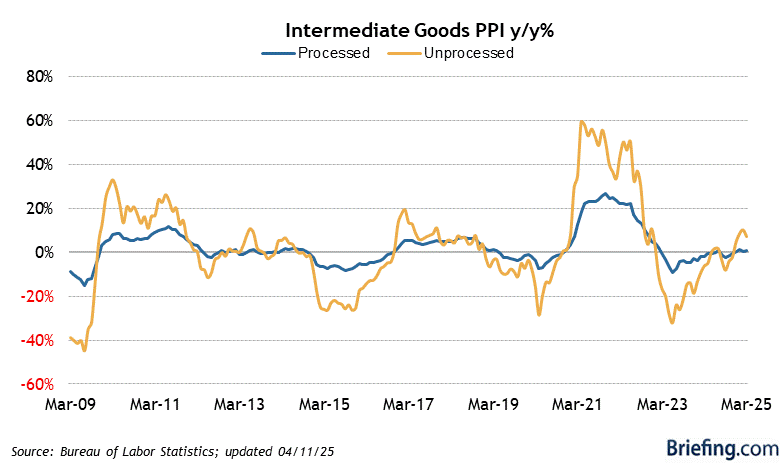
- The index for processed goods for intermediate demand fell 1.2%, breaking a string of seven straight increases.
- The index for unprocessed goods for intermediate demand dropped 4.1%, the biggest drop since May 2023. Over 70% of the decline was attributed to an 8.1% decline in prices for unprocessed energy materials.
Big Picture
- The key takeaway from the report is that it is an encouraging monthly marker of how the inflation data can improve with a decline in energy prices; however, it also reveals on a year-over-year basis that wholesalers are still dealing with high prices. Net-net, this report conveys the need for more improvement in bringing down wholesale prices, but it was better-than-feared when also factoring in the downward revisions to the prior month.
| Category | JUN | MAY | APR | MAR | FEB |
| Final Demand | -0.3% | 0.6% | 1.1% | 0.8% | 0.5% |
| Core (excluding ...) | |||||
| Food and Energy | 0.2% | 0.1% | 0.7% | 0.3% | 0.3% |
| Food, Energy, and Trade | 0.1% | 0.8% | 0.5% | 0.2% | 0.5% |
| Final Demand Goods | |||||
| Total | -1.4% | 2.3% | 1.9% | 2.0% | 1.0% |
| Energy | -6.4% | 8.4% | 7.2% | 10.5% | 2.0% |
| Finished Goods | -1.4% | 2.4%` | 1.6% | 1.7% | 0.9% |
| Final Demand Services | |||||
| Total | 0.2% | -0.1% | 0.7% | 0.3% | 0.3% |
| Trade | 0.4% | -2.3% | 1.3% | 0.5% | -0.3% |
| Intermediate Demand | |||||
| Processed | -1.2% | 2.8% | 2.7% | 2.9% | 1.5% |
| Unprocessed | -4.1% | 3.2% | 1.7% | -0.2% | 5.9% |
| Services | 0.3% | 0.6% | 0.9% | 0.1% | 0.3% |